Case Details
Client: Sell My Car Pty Ltd
Location: Melbourne, Australia

Domo - Conversion Funnel

Requirement

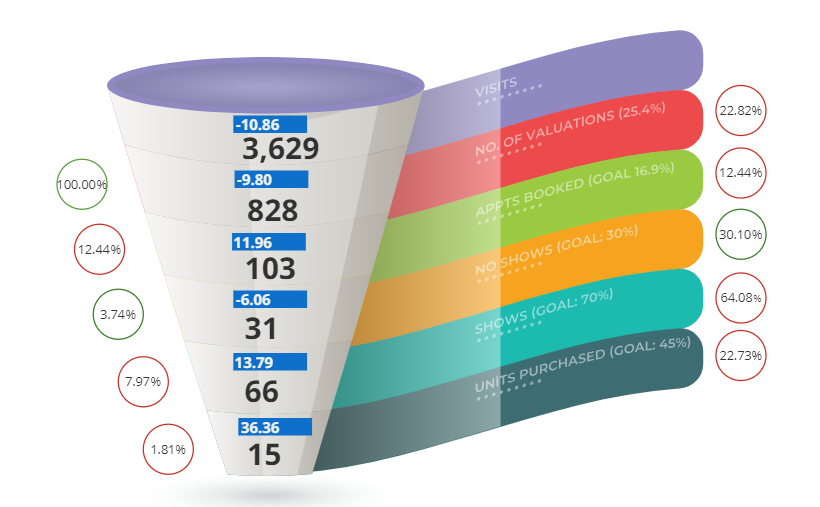
The client operates an Australia-wide car buying business, the client wished to obtain an 'at a glance' view of business performance. Within this car buying business, there are a number of stages that a customer must complete before a vehicle is purchased.

These stages include: creating an online valuation, booking an appointment and the attendance of an appointment at a buying centre.

Within the business, each business department has an overall responsibility for each stage. The operating performance at each stage and the overall business performance is something that needs to be carefully monitored by management and the Head of Retail.

Previously, the client was producing this conversion funnel semi-manually using Excel and PowerPoint.
domo
Challenges
1. Combining Various Data Sources
The data that the customer wished to present, in the conversion funnel, was from a variety of different sources:

  • Customer Relationship Management (CRM) application
  • Google Analytics
  • Dealer Management System (DMS)
  • 2. Aligning Time Periods
    To provide an accurate representation of business performance, it was important to ensure that the different time periods of each data source were correctly aligned
    3. Monthly and Week on Week Change
    Within the same view as the conversion funnel, the customer wished to see the percentage and actual changes week on week and month on month
    Solution

    Illustrator, Combined Data Sources, SQL Query and Magic ETL

    In Adobe Illustrator, a custom funnel was designed. With the Domo Illustrator plugin, the funnel design was uploaded into the client’s Domo instance.

    Next, the client’s data was connected using the Google Analytics, CSV and MYSQL connectors. A custom SQL query pulled in the relevant data periodically.

    To connect the data together and transform the data appropriately, Domo’s Magic ETL function was used.

    Using a Domo Card, the transformed data was filtered and then pulled in.

    Impact

    The business has an automatic, at a glance, view of business performance in Real-Time, each week and each month. The view compares the changes month over month and week over week. An 'at a glance' card provides an overall view and also by State.

    The presentation of the information is completely automated.

    Send a Message

    Let Athena IT know about your project or initiative, we will write back to discuss further